
Population and Aging at a Glance
This slideshow steps through five World Bank indicators on population and aging, one frame per indicator. Each frame shows a ranking bar chart, the highlighted country's value and rank, and a trend line for the past twelve years. All figures come from the World Bank's World Development Indicators for 2024.
| Total population | 3 | The US has 340,110,988 people, 3rd of 217 |
| Total fertility rate | 133 | The US fertility rate is 1.6265 births per woman, 133rd of 217 |
| Life expectancy at birth | 61 | US life expectancy at birth is 78.89 years, 61st of 217 |
| Population aged 65 and over | 45 | 17.93% of people in the US are 65 or older, 45th of 217 |
| Crude death rate | 155 | The US crude death rate is 9.0 per 1,000 people, ranked 155th of 217 |
Read each frame on its own: the value and rank at the top, the bars for who leads and trails, and the line for the direction of change. Do not compare values across frames — the units differ (people, births per woman, years, percent, deaths per 1,000), and the world figure for total population is a sum while the others are averages.
The Short Version
Across this theme, the United States sits near the top on size and in the middle on almost everything else. Its most striking figure is total population: 340,110,988 people in 2024, ranking 3rd among 217 countries and territories, behind only India and China. On the other measures the U.S. is closer to the middle of the pack — 133rd of 217 on the fertility rate (1.6265 births per woman), 61st on life expectancy (78.89 years), and 45th on the share of people aged 65 and over (17.93%). The pattern is a large, moderately aging country whose fertility and longevity numbers trail those of most other high-income peers.
*Source: World Bank, World Development Indicators (2024).*
The Headline Number
The lead indicator here is total population. The United States recorded 340,110,988 people in 2024, 3rd of 217 countries and territories. The "world" figure of 8,141,808,945 is a total rather than an average, so the useful comparison is a share: the U.S. accounts for roughly 4.2% of the world's people. Only two countries are larger — India at 1,450,935,791 and China at 1,408,975,000 — and each is more than four times the U.S. figure.
*Source: World Bank, World Development Indicators — Population, total (SP.POP.TOTL), 2024.*
Who Is at the Top and Who Is at the Bottom
The top of the population ranking is a list of the world's demographic giants: India (1,450,935,791), China (1,408,975,000), the United States (340,110,988), Indonesia (283,487,931), Pakistan (251,269,164) and Nigeria (232,679,478). At the other end are small islands and micro-territories: Tuvalu (9,646), Nauru (11,947), Palau (17,695) and St. Martin (26,129). The United States is unambiguously at the large end, third in the world.
On the share of people aged 65 and over, the top of the table looks quite different — Monaco (36.17%), Japan (29.78%), Puerto Rico (24.72%), Italy (24.62%) and Portugal (24.53%) — mostly European countries and small territories. The United States, at 17.93%, ranks 45th, above the world value of 10.20% but well below that leading group.
*Source: World Bank, World Development Indicators — Population, total (SP.POP.TOTL) and Population ages 65 and above (SP.POP.65UP.TO.ZS), 2024.*
How the Past Decade Changed Things
Between 2013 and 2024 the U.S. population grew from 316,726,282 to 340,110,988 — an increase of about 23.4 million, or 7.4%. Over the same period the fertility rate fell from 1.8575 to 1.6265 births per woman, a decline of 0.23. The share of the population aged 65 and over rose steadily every year, from 13.70% to 17.93%, a gain of 4.23 percentage points.
Life expectancy followed a different, hill-shaped path. It was 78.74 years in 2013, edged up to 78.79 by 2019, dropped to 76.98 in 2020 and 76.33 in 2021, then recovered to 77.43 in 2022, 78.39 in 2023 and 78.89 in 2024 — its highest value in the twelve-year series. The crude death rate moved in a mirroring pattern: 8.215 per 1,000 in 2013, rising to 10.27 in 2020 and 10.4 in 2021, then easing back to 9.8, 9.2 and 9.0 in the three years that followed. Some of that remaining elevation reflects the older age structure shown above, since the crude rate is not age-adjusted.
*Source: World Bank, World Development Indicators — Population, Fertility rate, Life expectancy at birth, Population ages 65 and above, and Death rate (crude), 2013–2024.*
Comparing with Similar Countries
Among large high-income countries, the U.S. fertility rate of 1.6265 is at the higher end: above Germany (1.36), the UK (1.551), China (1.013), Japan (1.15) and South Korea (0.748), and just above France (1.61). On aging, the U.S. share of 17.93% aged 65 and over is 5.27 percentage points below Germany (23.20%), 4.22 below France (22.15%), and 1.57 below the UK (19.50%) — but 3.26 points above China (14.67%) and 11.85 points below Japan (29.78%).
Life expectancy is where the gap runs the other way. At 78.89 years, the U.S. trails Japan (84.04) by about 5.1 years, South Korea (83.63) by 4.7, France (82.98) by 4.1, the UK (81.39) by 2.5 and Germany (80.79) by 1.9, and sits just under a year above China (78.02). The U.S. crude death rate of 9.0 per 1,000 falls between France (9.4) and China (7.76), below Japan (13.3) and Germany (12.1) and above South Korea (7.0).
*Source: World Bank, World Development Indicators, 2024.*
How to Read These Numbers
A few definitional points matter. The total fertility rate is a synthetic figure: it sums age-specific birth rates for women aged 15–49 in a single year, and describes a hypothetical rather than the number of children women have actually borne over a lifetime. Life expectancy at birth is likewise a period measure — it assumes the mortality conditions of that year continue unchanged. The crude death rate is not adjusted for age structure, so countries with more older residents will tend to show higher values regardless of health conditions; comparisons on that indicator should be made with that in mind.
Rank direction also varies by indicator. For population, fertility, life expectancy and the 65-and-over share, rank 1 is the highest value; for the crude death rate, rank 1 is the lowest (the United Arab Emirates at 0.972). Total population counts residents, but the treatment of foreign residents and citizens living abroad differs between countries. All figures here are World Bank WDI estimates, updated about once a year and subject to revision, so they may not match national statistics exactly. The 217 entries include territories such as Monaco, Hong Kong, Macao, Puerto Rico and the Isle of Man alongside sovereign states; values for places with populations in the tens of thousands can move sharply, and the set should not be treated as a like-for-like comparison of nations.
*Source: World Bank, World Development Indicators (SP.POP.TOTL, SP.DYN.TFRT.IN, SP.DYN.LE00.IN, SP.POP.65UP.TO.ZS, SP.DYN.CDRT.IN), 2024.*
Total population on the map and in charts
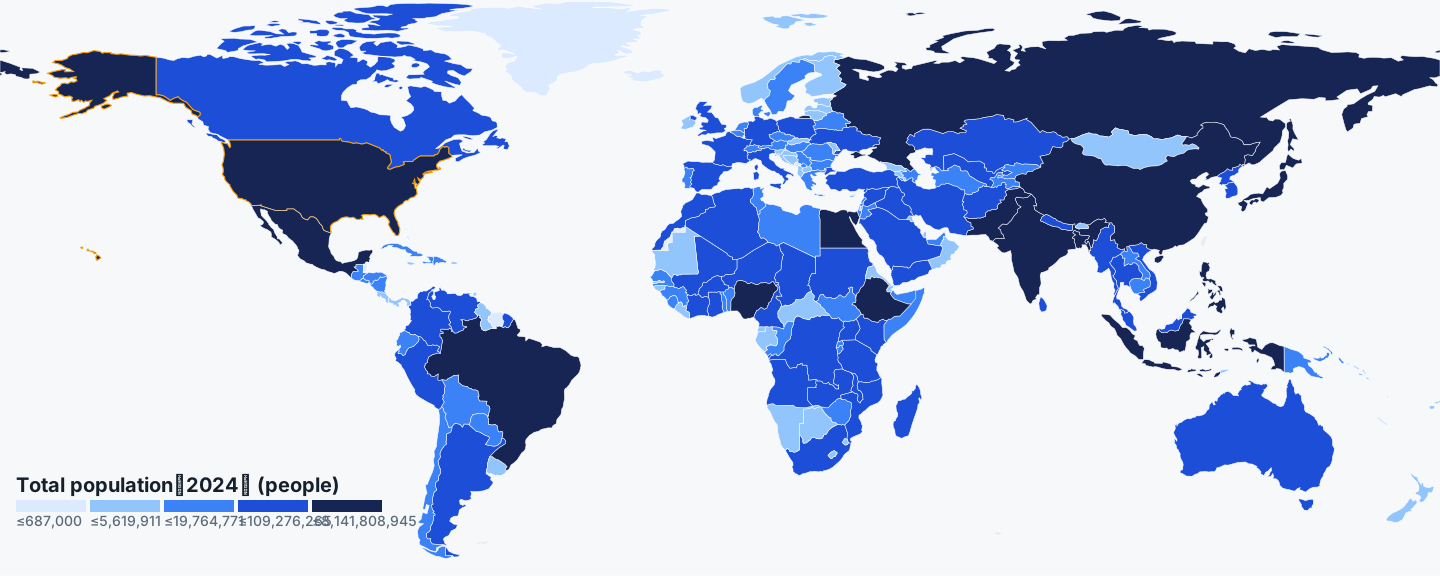
The top of the table is the demographic giants — India, China, the US, Indonesia, Pakistan. The bottom is small islands and territories, ending with Tuvalu at 9,646; the US sits third from the top.
The bars show how far the top two stand apart from everyone else, with India and China each more than four times the US. The trend line rises steadily from 316,726,282 in 2013 to 340,110,988 in 2024.
Compare countries
Total fertility rate
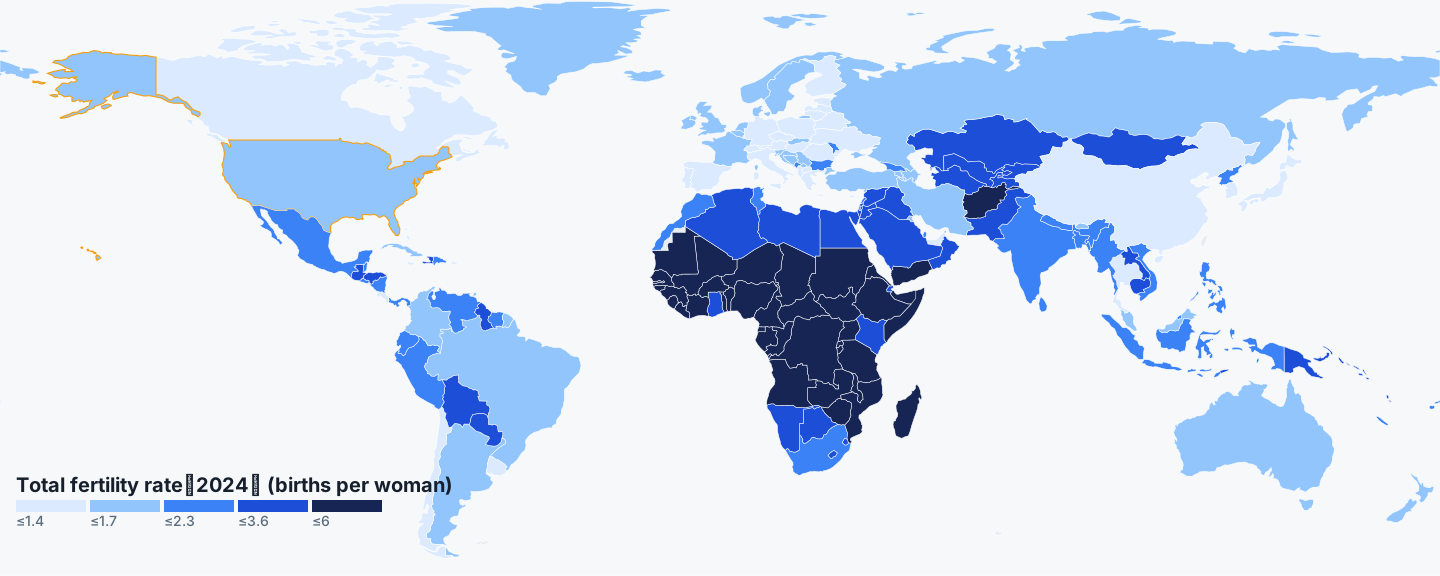
| Rank | Country / area | births per woman |
|---|---|---|
| 1 | Chad | 6.03 |
| 2 | Somalia | 6.01 |
| 3 | Congo - Kinshasa | 5.98 |
| 4 | Central African Republic | 5.95 |
| 5 | Niger | 5.93 |
| 131 | Serbia | 1.64 |
| 132 | Colombia | 1.63 |
| 133 | US | 1.63 |
| 134 | Brazil | 1.61 |
| 135 | France | 1.61 |
| 215 | Hong Kong | 0.84 |
| 216 | South Korea | 0.75 |
| 217 | Macao | 0.58 |
Chad (6.028), Somalia (6.013) and Congo - Kinshasa (5.981) lead the table; Macao (0.582), South Korea (0.748) and Hong Kong (0.841) sit at the bottom. The US is 133rd, in the middle third.
The bars span a wide range, from above 6 to below 0.6 births per woman. The US line falls from 1.8575 in 2013 to 1.6265 in 2024, with the lowest point at 1.6165 in 2023.
Life expectancy at birth
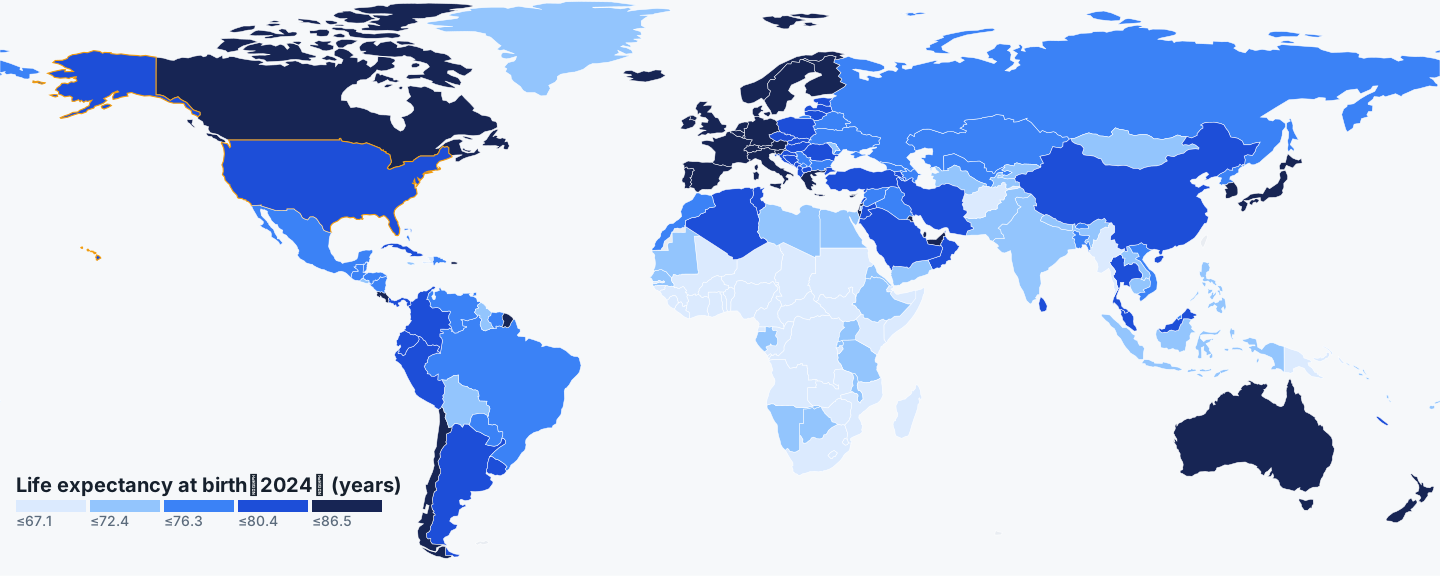
| Rank | Country / area | years |
|---|---|---|
| 1 | Monaco | 86.5 |
| 2 | San Marino | 85.82 |
| 3 | Hong Kong | 85.39 |
| 4 | Kuwait | 84.58 |
| 5 | Switzerland | 84.41 |
| 59 | Croatia | 78.93 |
| 60 | New Caledonia | 78.92 |
| 61 | US | 78.89 |
| 62 | Poland | 78.41 |
| 63 | Slovakia | 78.37 |
| 215 | Central African Republic | 57.67 |
| 216 | Chad | 55.24 |
| 217 | Nigeria | 54.63 |
Monaco (86.497), San Marino (85.817) and Hong Kong (85.3927) top the list, with Nigeria (54.635) and Chad (55.238) at the bottom. The US sits 61st, above the world value but below every other large high-income peer shown.
The bars stretch across roughly 32 years between the top and bottom of the table. The US line dips from 78.79 in 2019 to 76.33 in 2021, then climbs back to 78.89 in 2024 — its highest value in the series.
Population aged 65 and over
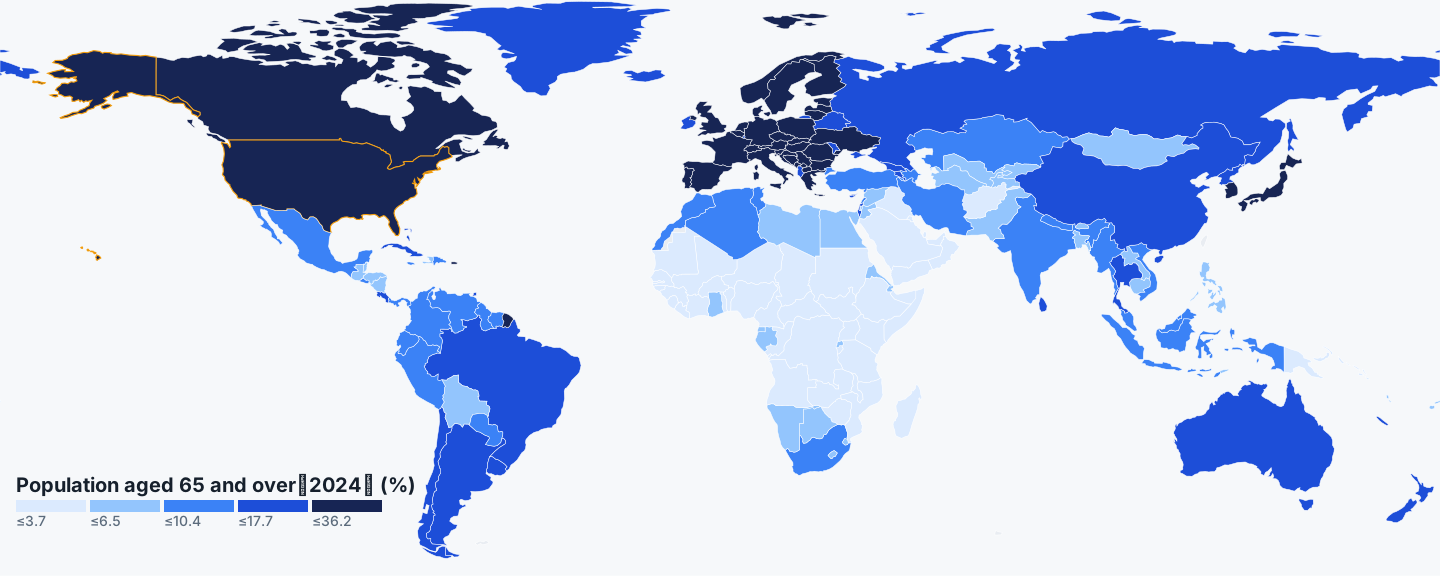
| Rank | Country / area | % |
|---|---|---|
| 1 | Monaco | 36.17 |
| 2 | Japan | 29.78 |
| 3 | Puerto Rico | 24.72 |
| 4 | Italy | 24.62 |
| 5 | Portugal | 24.53 |
| 43 | St. Martin | 18.41 |
| 44 | North Macedonia | 18.02 |
| 45 | US | 17.93 |
| 46 | Montenegro | 17.83 |
| 47 | Faroe Islands | 17.74 |
| 215 | Zambia | 1.95 |
| 216 | United Arab Emirates | 1.77 |
| 217 | Qatar | 1.68 |
Monaco, Japan, Puerto Rico (24.7187%) and Italy (24.6248%) head the table, mostly European countries and small territories; Qatar (1.6758%) and the UAE (1.767%) are at the bottom. The US ranks 45th.
The bars show a spread from about 36% down to under 2%. The US line rises every single year, from 13.7012% in 2013 to 17.9287% in 2024 — the steadiest climb of the five indicators.
Crude death rate
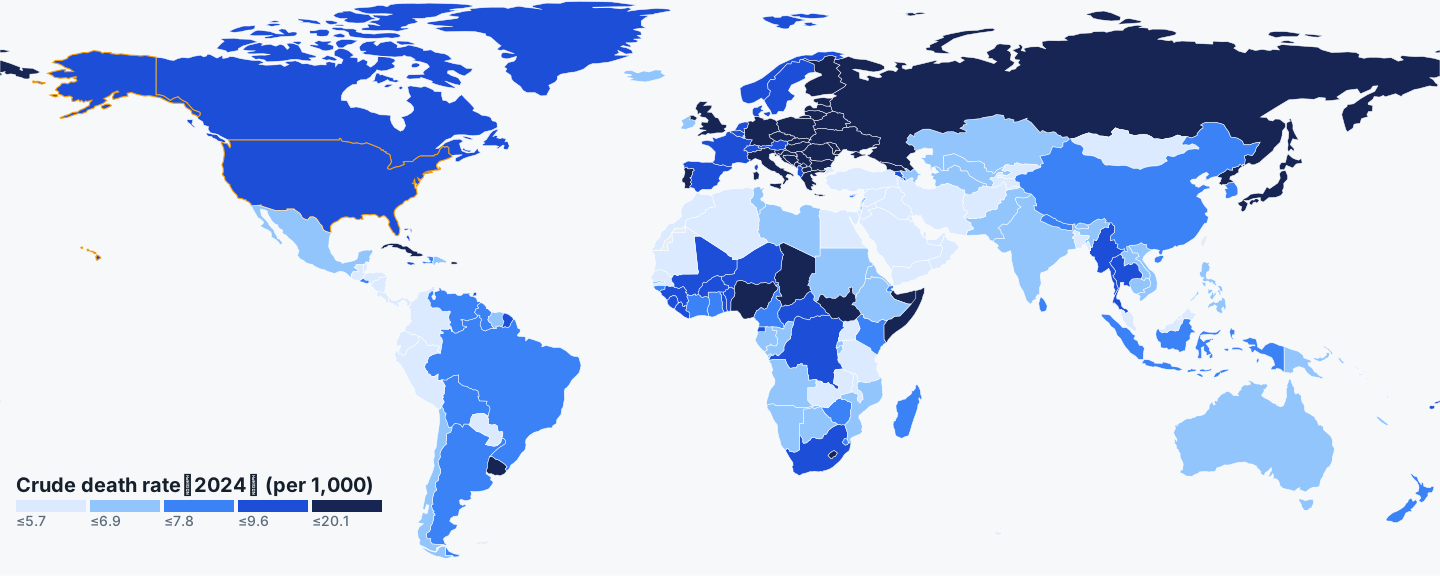
Ranks run from lowest to highest: the UAE (0.972) and Qatar (1.051) come first, Monaco (20.141) and Bulgaria (15.6) last. The US is 155th, higher than South Korea (7.0) and China (7.76) but below Japan (13.3).
The bars separate countries with young populations from those with old ones, since this rate is not age-adjusted. The US line rises from 8.215 in 2013 to 10.4 in 2021, then falls back to 9.0 in 2024.